ABOUT
About Me & My Skills

Fatima M. Salman
Data Analyst
Passionate about turning numbers into insights. I build interactive dashboards and analyze data to help organizations make fact-based decisions.
BI & VISUALIZATION
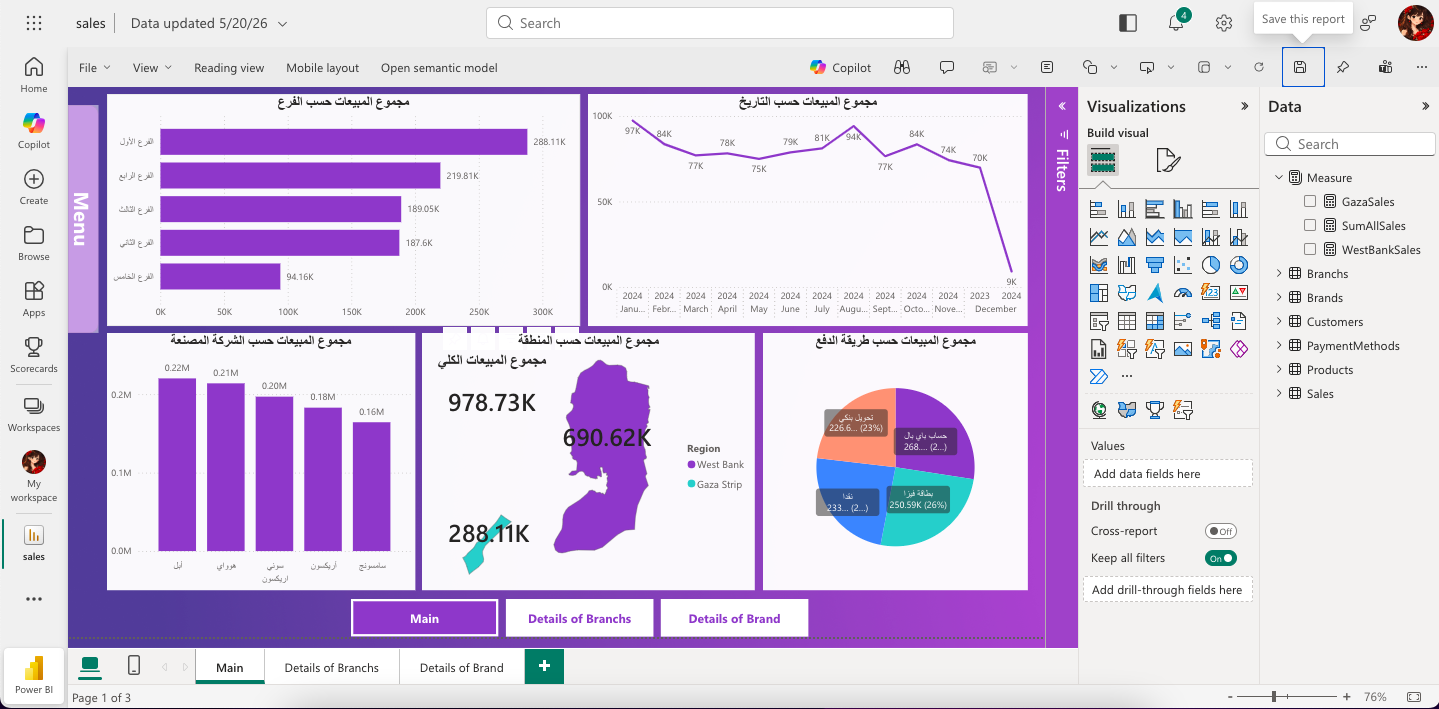
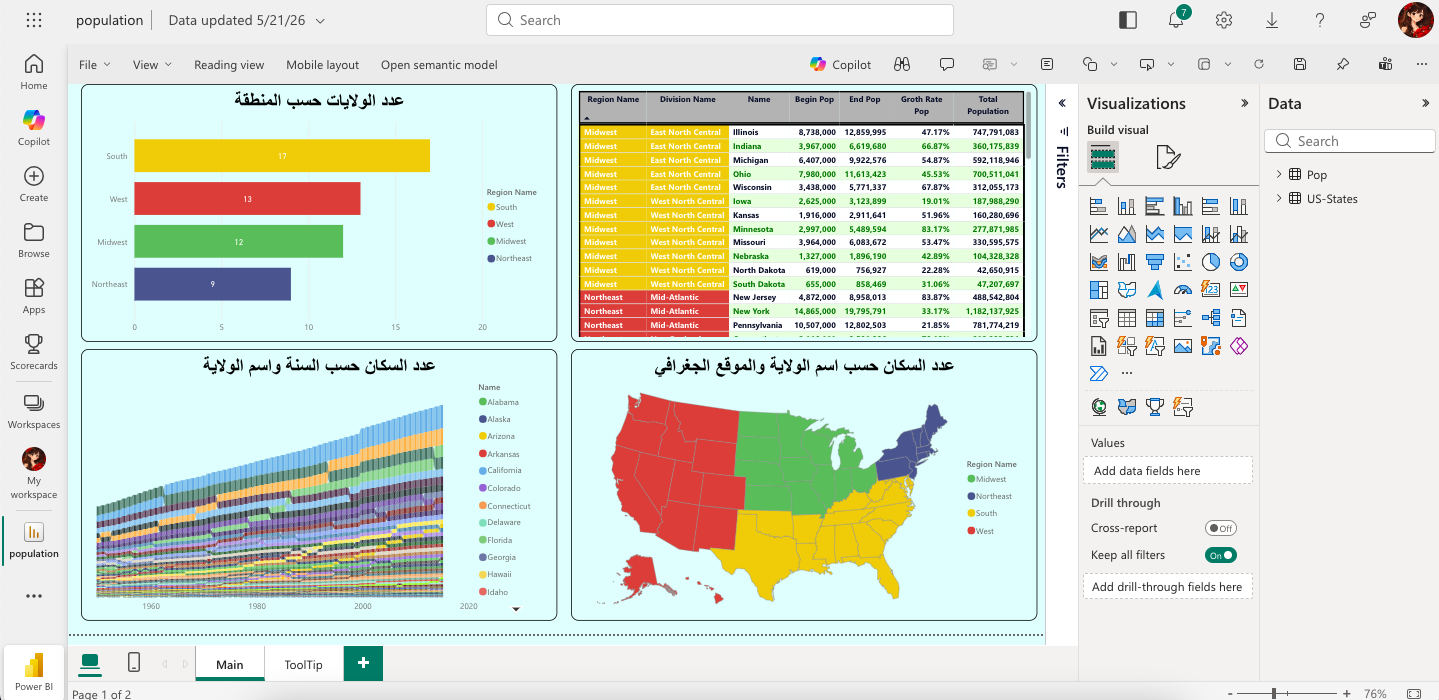
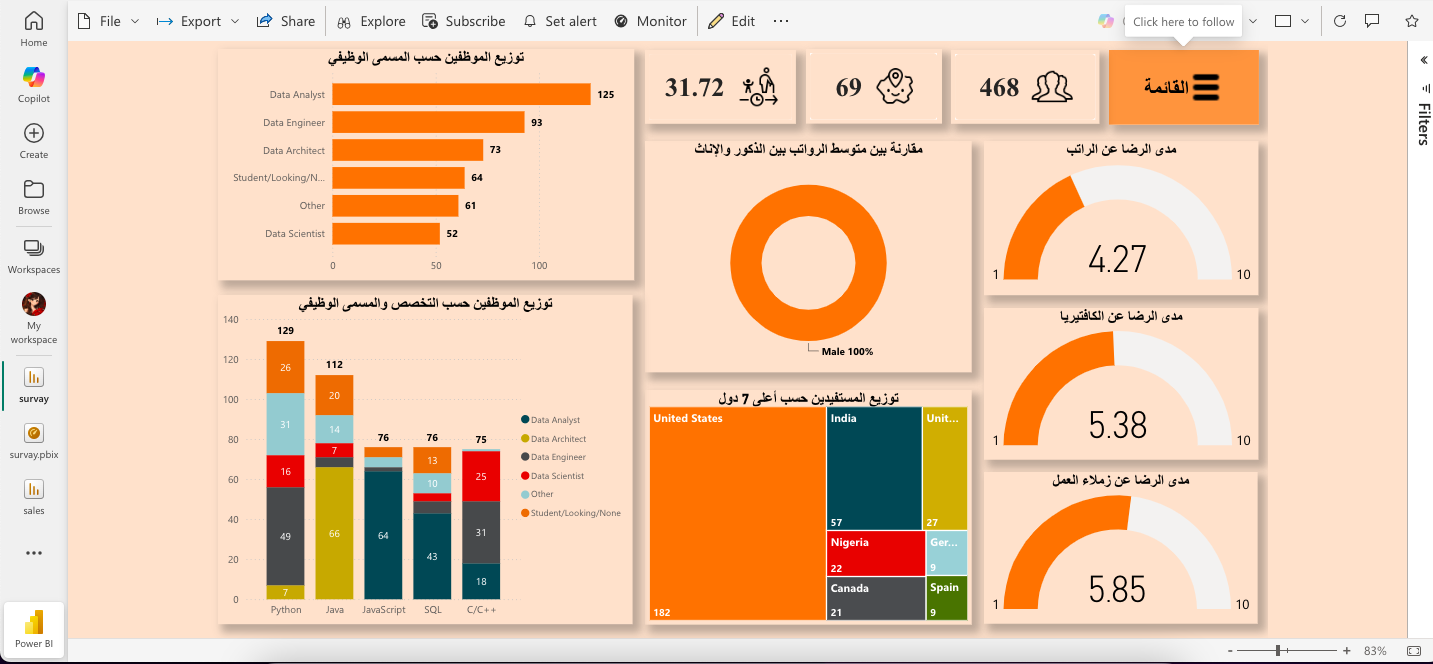
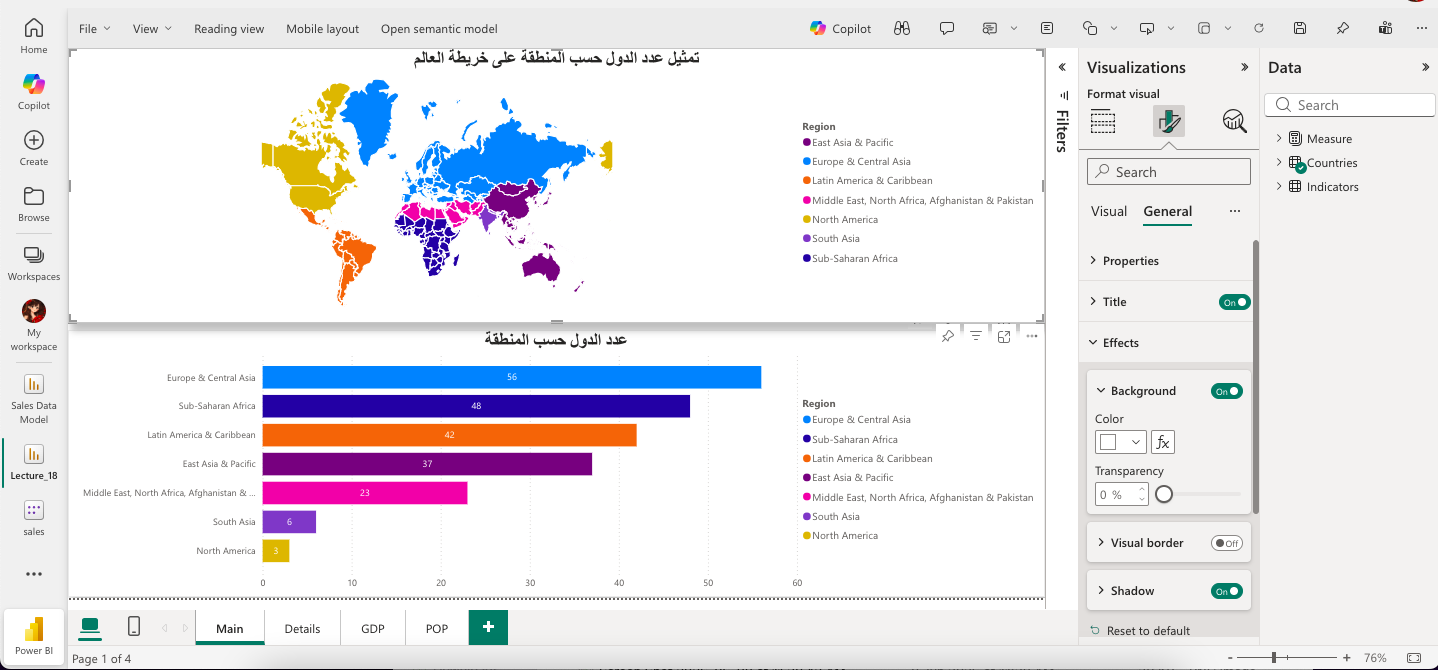
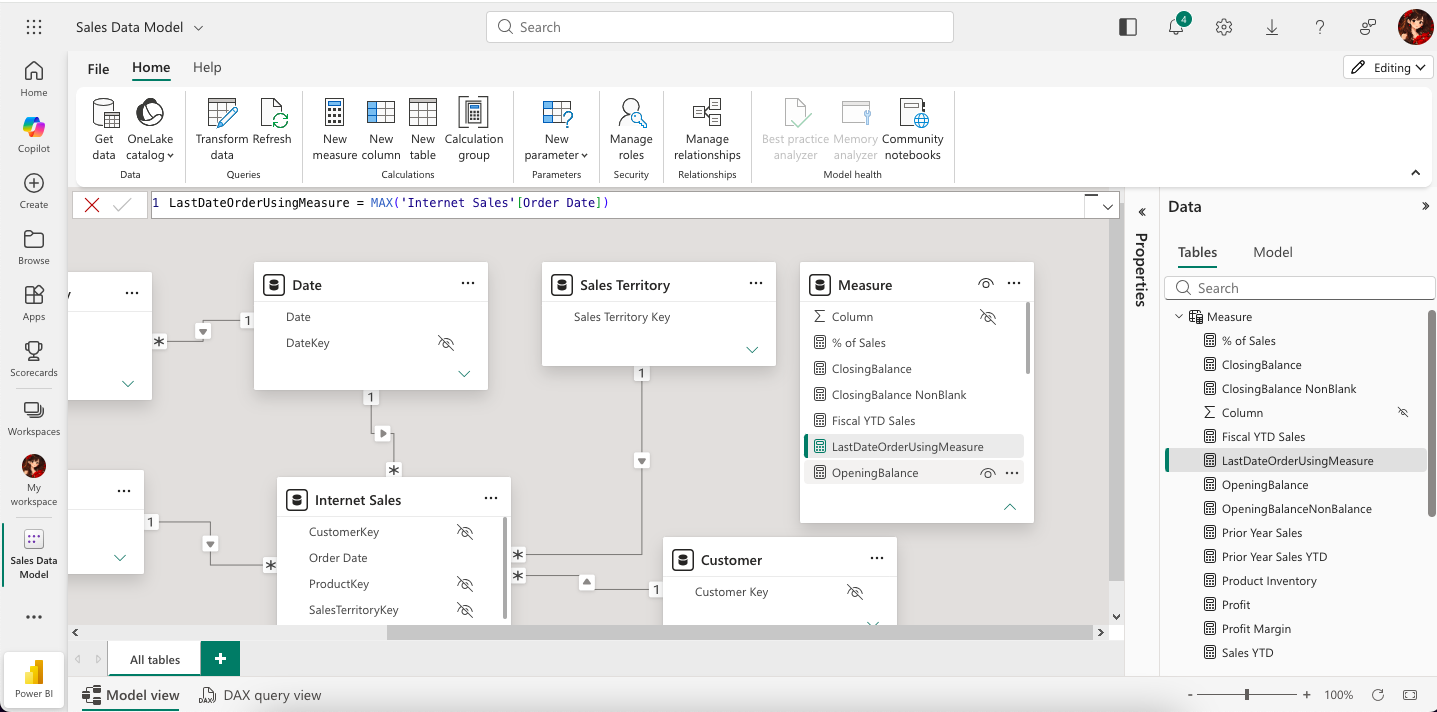
Power BI
Tableau
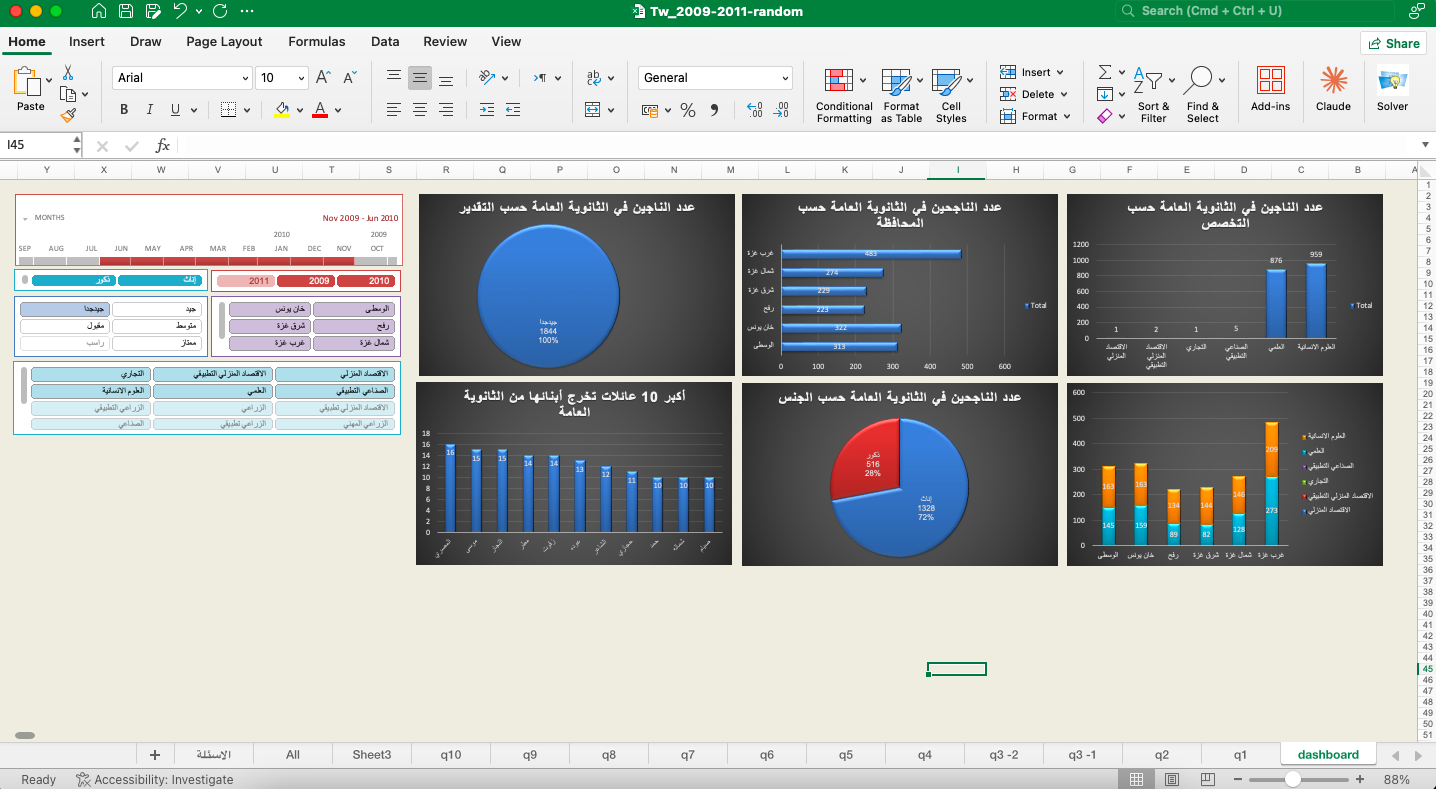
Excel Dashboards
DAX
DATA & DATABASES
SQL
PostgreSQL
BigQuery
Data Modeling
ETL
PROGRAMMING & ANALYSIS
Python
Pandas
Matplotlib
Seaborn
Scikit-learn
SOFT SKILLS
Business Analysis
Data Storytelling
Problem Solving
Communication